Why is my Health status on my Cisco FMC always Critical? !@#$% …
Do you have this Critical Alert on your FMC and you just leave it because you can’t get it to stop? Are you going batty over this like all my other customers?

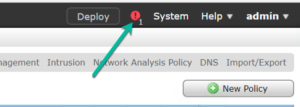
Do you want it to always look like this, except when you actually have a problem?
![]()
You are not alone! There is help, and in less than 12-steps, I promise that you get your sanity back!
First, you need to understand why you are getting these Critical alerts. Regardless if you have an ASA with Firepower or FTDdevices, the answer for both devices is your interface status, and you probably know that already, but why is this happening? It seems that everything is working so what gives?
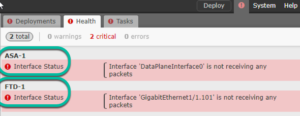
Both types of devices think that an interface is either: “DataPlaneInterface0 is not receiving any packets” or “Interface GigEthernet0/0.101 is not receiving packets”…to create an easy example for you, I added a FTD and ASA into my FMC and just left the defaults. Here are the results. Look familiar?

…this is happening for only slightly different reasons between the boxes. The key on the ASA is the HA and the answer on the FTD is the sub interface. Let’s solve both issues:
ASA with Firepower
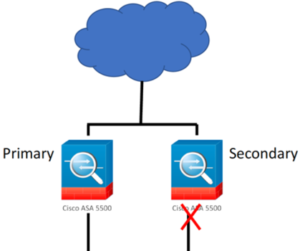
If you have ASA’s you’ll have a Primary and a Secondary group for HA as shown:

The Secondary in the group does not communicate on the inside interface, so the device will start issuing a critical alert: “DataplaneInterface0 is not receiving packets”…this is annoying because what it is saying is that “I’m working correctly, and I just wanted you to know, so here’s a Critical alert message every 5 minutes! :)”.
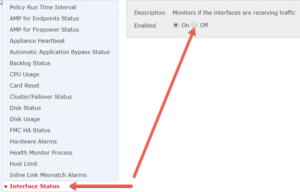
To solve this ASA w/Firepower issue, you need to create two different health policies, a Primary and a Secondary. On the Primary, just leave the defaults, but in the Secondary policy disable Interface Status as shown:

Now just apply the Primary Health Policy to the Primary ASA as well as to the FMC, and the Secondary Health Policy to the Secondary ASA device.
![]()
Click the green check mark to apply and deploy the policy.
We can see that the ASA is no longer providing inaccurate Critical alerts, but we still need to fix our FTD device.

Let’s do that now.
Firepower Threat Defense (FTD)
The FTD device is providing a slightly different Critical error, but the solution is the same. The interface is receiving packets, unlike the secondary ASA, but it is not registering because it is a subinterface. This is an issue that Cisco needs to resolve. In the meantime, just apply the same secondary policy that was applied to the Secondary ASA and you’ll stop receiving these messages.
![]()
After you click on the green check mark, choose the device and press Apply. Notice the ASA is already assigned to the Secondary policy and is happy!
After the policy is applied, now my FMC will only tell me if a true Critical alert happens! How beautiful is this picture?
![]()

I have a similar problem with FTD in HA pair, Critical alert on FMC shows that the standby FTD is not receiving packets on 3 out of 17 sub-interfaces of a port-channel .
Unlike ASA-FP, FTD in HA pair does not give an option to assign different health policies to active and standby device. Do you have any workaround for FTD in HA pair to turn off the interface status monitoring?
You need to turn off the interface status in the health policy applied to your FTD devices that have sub interfaces. That is the only workaround unfortunately.
Another question: What will happen when a Failover occurs? I’m assuming that the Secondary Health Policy (HP) will remain on the Secondary Active ASA/FTD now; thus the Primary Standby ASA/FTD will now generate alerts because of the Primary HP which is monitoring the Interface Status. Please correct me if I’m wrong but I guess that the issue will continue when there’s a Failover event.
no, because they are virtually one device, not two, so you don’t have this issue.
When I try to apply second policy, it will only allow me to apply to the cluster, Active and standby, not one or the other..Is there a way round that?
In case of failover, we still get this alarm as on primary (now Standby) has the policy which monitors the interface for traffic.
with ASA with Firepower, you must disable the interface monitoring for both ASA devices, assuming HA pair.
But if you disable the interface status for both devices you will lose any other possible alarm.
you still have plenty of viability. I recommend disabling the interface monitoring in FTD
Here im talking about ASA with Firepower (Separate SFR module). Is there any way to fix that ?
Under the System-Health-Blacklist you have option to edit the devices and use the blacklist feature to disable for example the interface monitoring and you can still use the same health_policy you don’t need to create another one.
We have a firepower HA cluster, and health policy can not be assigned to a specific device in the cluster.
This is great because with the blacklist we can specify the secondary device.
Thanks for this!
I was able to apply two unique health policies but I had to do this when they were not in HA. When they were brought together into HA they two policies stuck.
That is a solution that I need to add to this blog, as you can just blacklist a certain health alert
thank you,
Todd Lammle
Any idea, what kind of traffic is receiving on the standby’s FTD device interfaces. In my case, there is no standby IP address assigned to each interface but still showing bytes count on the interface.
It still syncs the configuration, it has to
Hi,
I am facing below issue. FTD 9300 are in HA and managed by FMC. both FTD connected to ACI fabric switch with port channel. 5 sub interfaces are available. when i add 5th sub interface for HA monitoring, FMC shows below error.
cluster/failover status
secondary failover state standby failed(check peer event for reason).
what could be the reason, why fmc throw this error. how do fix it.
Suppose i disable health policy for monitoring cluster/failover status, how do i come to know, what is happening in cluster/failover status.
No, this is another issue altogether. Go to CLI and verify connection.
Check your physical connection between devices, and then swap primary/secondary to active and back. Wait 30 minutes to see if it clears, and if not resolved, open a TAC case
thanks,
Todd
Hi,
I am facing the issue similar to it but its for CPU. The FMC health alert is showing as
CPU usage using CPU20 100%
CPU usage using CPU60 99.99%
why the snort engine hitting only these 2 cores. i can see this notification for every few seconds. how can i fix this issue. please suggest here.
Hello, you have a what they call and elephant flow. Please call TAC and open a case, they can fix that for you.
Hello, Is there no way to monitor interface throughput when using sub interfaces? We still have to disable the interface monitoring to avoid the critical alarms caused by the physical interface reporting no packets, while the sub-interfaces are OK. We are running FMC 7.0.4 with only FTD devices.
There really isn’t, nor can you route out one sub into a different sub on the same interface.
I usually create a separate health policy for my FTD’s with subs on them because of this, and then disable the interface monitoring. You’ll still know if a problem occurs, but the sub interfaces are limited in this manner
Thank you for responding. Right, I was afraid of this.
I find it kind of odd that Cisco sill haven’t provided us with a way to select what interface to monitor and not when there is this situation with phy vs sub interfaces in the health monitor. In my simple world that seems like something they would be able to do :) ..and something that probably should have been there quite early.
I think very few of our FTDs are w/o subs, so we’ll just have to disable the interface monitoring and find other ways to monitor throughput.
This hasn’t really been an issue for me, as there are plenty of ways to know if that interface somehow goes down, but this has been an issue since 6.0 code…but there are a lot of advantages to the Snort process in the 7.x code, so I just keep my eye on the prize here, and don’t worry about this one piece…but ill bring it up to them again on monday in our beta meeting
It sounds like there might be an issue with the monitoring settings on your Cisco FMC causing your health status to always show as critical, I recommend reaching out to the Cisco support team for assistance in resolving it.
I see suggestions for disabling interface status in health checks or blacklisting (excluding) the interface status health module for devices. I wouldn’t call these solutions, but workarounds with caveats.
If you modify the health policy to exclude interface status, you will get rid of the alarms, but you lose your traffic statistics in the health monitor.
If you turn to the exclude list and disable the interface status module, you will keep statistics, but you will not get alarms for interface down events. So I wouldn’t recommend that if you are relying on FMC for monitoring.
Thanks, Clayton. I have found that after they see the status, they no longer care. It does not typically matter to most of my customers.
But thank you for the information and clarification; that is an excellent workaround idea!
Todd